Data Visualization: Tips For Analyzing Work and Asset Data
[Republished 2023]
You spend your days inspecting and maintaining streets, water mains, signs, parks, and more. But, how much of that work is reactive vs. proactive? Do you know how much money each department has spent this month? Are you meeting your service-level commitments? When will you need to buy a new snow plow or street sweeper?
Sure, you could answer these questions by creating filters, exporting a List view, or running a report. But, the best way is to visualize that data using your Analytics Dashboard gadgets.
What makes this option better? Simple: we’re visual creatures, and it’s easier to see patterns in a chart than in a List view. When you can see trends in your data, you can make better decisions, and ultimately, become more efficient and productive.
OpenGov’s customizable dashboard allows you to create several different gadget types, each with their own strong suits. Wondering which gadget type is best for your data set? Let’s take a closer look at them now.
Column and bar charts
Column and bar charts are user favorites and help to compare changes over a period of time for one or more groups. Use a column or bar chart when:
- The actual value is important
- You’re trying to compare items
- You have a small number of bars per group
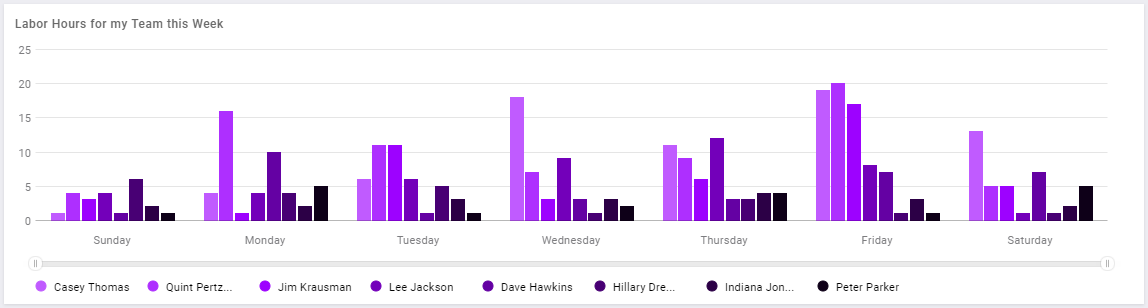
If you’re a manager, supervisor, or admin, these charts are right up your alley. Each allows you see the bigger picture, such as how your crews are doing or which materials should be stocked in higher quantities. In the column chart example below, Labor Hours for My Time This Week, we can see who’s logging hours, on what days, and their total per day.
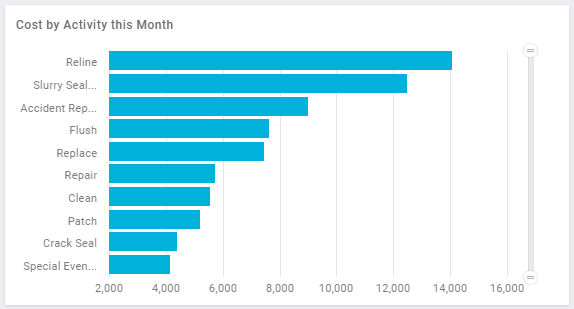
Bar charts are similar to columns charts, except they display horizontally and use label space better, as seen in this Cost by Activity This Month chart.
Pie charts
Pie charts are a great option if you’re dealing with a single set of data and are trying to understand areas of growth or want to compare parts to a whole. It’s a good idea to use a pie chart when:
- The exact value is less important
- You have six or fewer slices
- You’re not trying to track changes over time
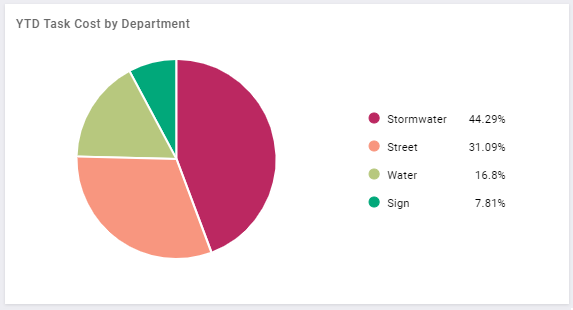
In this pie chart example, we’re looking at which department is spending the most. In many cases, pie and bar charts can be used interchangeably. Except, when you have more than six slices, change your data visualization to a bar or column chart.
List
Lists are a way to help us digest data bite by bite, instead of all at once. They’re an easy way to organize the chaos of your day and to make sure you don’t forget important details. Use a list gadget when:
- You want to analyze values one by one
- You’re less interested in analyzing values against each other
- You don’t need to see the bigger picture
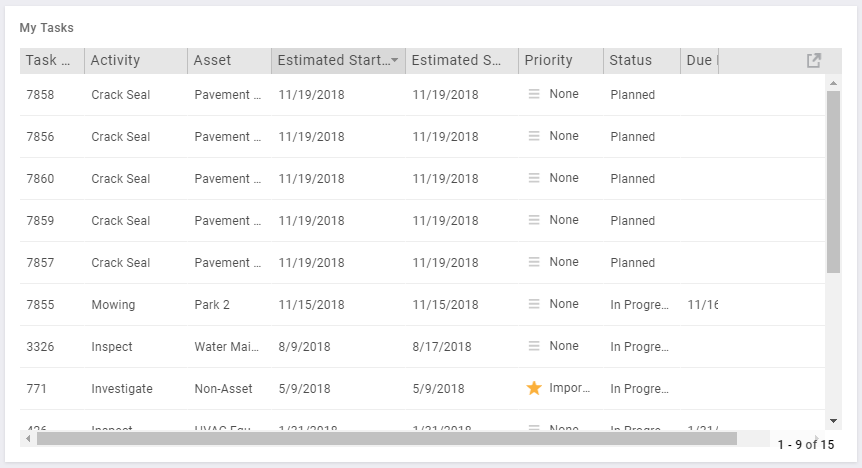
Pretty self-explanatory, the Analytics Dashboard list gadgets are perfect for when you want to display a list of items. For example, if you’re a field worker, you may want to see a simple to-do list, like the My Tasks example below. This gadget helps you analyze each item, instead of grouping the data together.
Number
This gadget is often used to review quick-hit information and to keep tabs on the values that matter to you most. A number gadget is ideal when:
- You’re dealing with a solitary count, sum, or average of records
- You want an at-a-glance way to monitor a single metric
- You have limited dashboard space
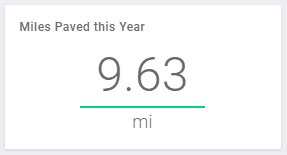
If you want to see how many feet of sewer mains you televised this year, how many signs are below the minimum condition, or how many miles you paved this year in real time, then the number gadget is perfect. Its smaller size also means you can fit more them on your dashboard and stay in the know all day long.
Key performance indicator (KPI)
Our most advanced visualization, the KPI gadget was created with directors, supervisors, and managers in mind and can be used for any of your service-level agreements. Use the KPI gadget when:
- You want to track progress on a specific goal
- You’re trying to evaluate how your team or organization is performing
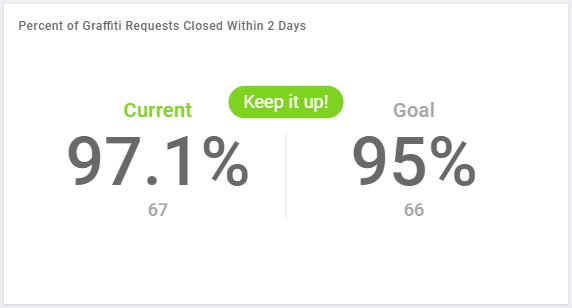
The KPI gadget shows your current progress, your end goal, and how the two compare. For example, if you have a service-level agreement with your citizens that says you’ll clean up graffiti requests within two days of being notified at least 95 percent of the time, the KPI gadget example below would help you track that commitment with ease.
Whether you’re just kicking off your high-performance journey and still collecting your assets or have started digging deeper into your data, remember to use the Analytics Dashboard with each of these different gadgets. Not only does it help your team become more effective and efficient, it helps you make more informed decisions and improve the quality of life of your citizens.
Related: Making Your Budget Process More Strategic
Categories: Asset Management, Product Advice